FY2025 Q3 Report
This report summarizes high-level capital spending, ridership, and train performance information over the past quarter along the Northeast Corridor. The NECC follows the federal fiscal year. Q3 is from April 1 - June 30.
Highlights include:
- Agencies invested $3.3B in infrastructure renewal and replacement over the first three quarters of FY25, a record for the corridor.
- Average weekday and weekend ridership remained stable compared to FY24Q3, however VRE, MARC, and CTrail all recorded YoY ridership increases in excess of 30%.
- 10.8% of all trains were late, annulled, or terminated, the same as in FY24Q3.
Hover your mouse over graphs to look at specific information, or click dropdowns and toggles where they exist to filter data to certain agencies.
Capital Spending
Year to date in FY25, NEC agencies have invested $3.7B in infrastructure. This is the highest combined Q1-Q3 spend in NEC history.
FY25Q3 Spend
▲ $455.7M vs. same quarter last FY
Ridership and Service
In the graphic below, you can select or unselect different agencies in the 'Agency Selection' box, and you can toggle between weekend or weekday ridership with the adjacent dropdown. Note that changes affect both the Ridership graphic and the Trains graphic below. Totals are annotated for the highest and lowest quarters, as well as the current quarter.
Q3 Average Weekday Ridership
▲ 20,350 riders vs. same quarter last year
Q3 Average Weekday Passenger Trains
▲ 6 Trains vs. same quarter last year
Overall, NEC ridership remained consistent year-on-year, decreasing by less than half a percent (3K trips).
While ridership was consistent corridor wide, VRE, MARC, and CTrail recorded year-on-year increases of over 30%, while MBTA and MNR recorded decreases of approximately 5%.
Average weekday service levels on-corridor remained consistent year-on-year.
However weekend services have increased considerably year-on-year, with increases driven by LIRR, SEPTA, and MBTA.
Train Performance
On-time Performance
In FY25Q3, overall 10.8% of trains were late, annulled, or terminated, the same as in FY24Q3. MBTA, CTrail, and SEPTA recorded the largest increase year-over-year in late trains of 3.0, 2.6, and 2.5 percentage points respectively, while VRE and NJT recorded the largest reductions of 2.7 and 2.1 percentage points respectively. All other operators had year-on-year changes under 1 percentage point.
Delay Causes
Train-delay Minutes
Train-delay minutes in FY25Q3 were spread throughout the quarter, with significant delay on June 23rd and 24th from a combination of heat orders caused by high temperatures, and 5 major incidents which occurred over the 2 days.
Major Service Incidents
Commission staff use a threshold of 5,000 total train-delay minutes or 1,500 infrastructure train-delay minutes to identify days which may have had major service incidents that disrupted service. Daily operations reports are reviewed to uncover any major service incidents that affected train performance. Those incidents are then compared with train delay records to quantify their impact. Fifteen major service incidents were identified in FY25Q3.

Spotlight: Reduction in Summer Electric Traction Delays on the NEC
Significant NEC catenary upgrades resulted in ET-related delay reduction in summer 2025
During spring and summer 2024, thousands of Amtrak and NJ TRANSIT passengers experienced several significant on-corridor delays in the New York Penn Station to Trenton (NYP-TRE) segment due to electric traction (ET) issues.
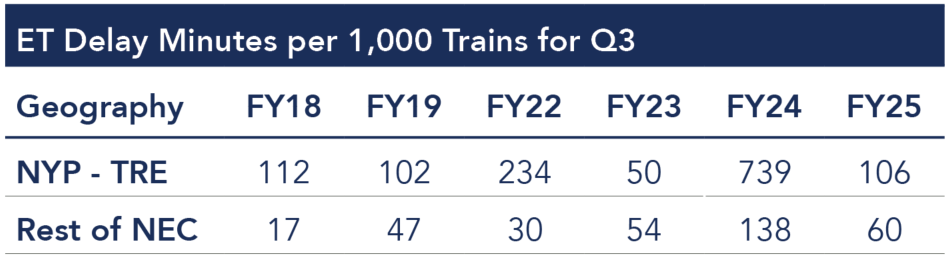
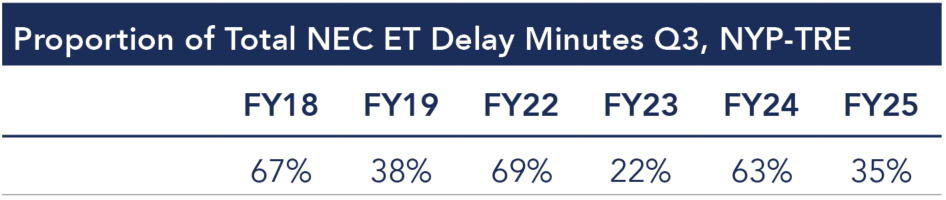
With 23% of all NEC services traveling through the critical 60-mile NYP-TRE segment the delays had ripple effects along the entire corridor. During FY24Q3 (April through June 2024), delays within the NYP-TRE segment accounted for 29,500 out of nearly 47,000 total ET delay minutes (or 63%). This represents 739 minutes of delay (over 12 hours) for every 1,000 trains.
Following these delays, Amtrak and NJT implemented a program to address ET state of good repair and prevent failures that included catenary and pantograph inspections, enhanced incident response preparation, the replacement of more than 9,500 hardware components, and installation of fiberglass chip protectors on pantographs.
Thanks to this partner agency cooperation, ET-related delay minutes in the NYP-TRE segment during Q3 fell from 29,500 minutes in 2024 to 4,200 minutes in 2025, while delay minutes per 1,000 trains fell by 86%. The proportion of total NEC ET delay minutes in this segment also reduced from 63% to 35% over the same time period.
The reduction in ET related delay minutes and improvement in train performance after targeted investment in the NYP-TRE segment underscores the importance of partner agency cooperation, and maintaining NEC assets to ensure reliable operations.